The Long View

Trapeze
The computer spreadsheet was the killer app of the pre-macintosh generation of personal computers. The program VisiCalc, by Dan Bricklin and Robert Frankston, created the market for computers in small businesses, and brought that business to the Apple II, on which VisiCalc first ran. According to Brinklin's own account, its first name was Calcu-ledger. Brinklin was a business student and the program was designed specifically as an electronic ledger sheet. The ledger sheet it created on the screen was a single table with columns labelled A, B, C, ... and rows labelled 1,2,3.... The resulting cells could contain values or expressions entered at the keyboard. There were two kinds of things you could enter: label entries or value entries. Label entries were text, and they had to begin with a letter (upper case was all there was) or a quote. Value entries had to start with a digit or one of these symbols: + @ - ( . #. Starting with a digit, minus sign or decimal point meant that you were entering a normal number or a simple arithmetic expression. Arithmetic expressions could refer to other cells in the ledger by name, as in '2*B6'. If you wanted to just refer to another cell, you couldn't use its name, as in 'B6', because that started with a letter and so would look like a label entry. You had to use the plus sign first, as in '+B6'. You could also enter a function, using the @ sign. For example, if you wanted to give the currently selected cell the value of the square root of whatever number was stored in cell B6, you could enter @SQRT(B6). You could also refer to a range of values in a column or a row, as in @SUM(A5...A12).

What was so great about VisiCalc?
I'm not an accountant and I can't speak to why it was so valuable to have an electronic ledger sheet. But as a computer enthusiast, what seems to me to have been so great about VisiCalc is that it created a live document. Because cells can be programmed to depend on other cells (by referring to them by name), changes in one part of the document automatically produced changes in all the other parts. Calculation could be set to be automatic, and to happen whenever a change was made, or to be manual, and made only when the operator requested an update. If you were creating a ledger by hand on a piece of paper, that kind of automatic recalculation would most definitely not happen. Think of it as a live document if you want to, that’s my preference. Or if you prefer, you could think of it as a simple programming system in which users could create a new application.
Design Purity
VisiCalc benefited from a pure design that made it simple and easy to understand. All cells were exactly equivalent to each other. Ledgers usually consist of columns of data that have the same type. For example, a column of label entries representing things you bought, a column of values giving the price of each thing bought, and a column showing the amount of money left after buying that item. To VisiCalc, this arrangement means nothing. Each cell is its own thing, evaluated using exactly the same rules, and position in the spreadsheet does not imbue any cell with any special property. You might think it would be good for the program to anticipate the way it usually gets used, and to provide some convenience to users making ledgers out of columns of data. This would make it easier to enter data. But if you did that, you would have to place restrictions the use of the program that would require the user to learn more. Users don’t want to have to learn much. VisiCalc didn’t require users to learn a bunch of things or to follow a bunch of rules. Put anything you want in any cell you want to put it in. Easy to learn, even at the cost of some tedious repetition to use.
Great Artists
VisiCalc pretty much owned the spreadsheet market on the Apple II for a couple of years, but soon there was competition. Microsoft had a spreadsheet program, Multiplan, released in 1982. Multiplan was a blatant ripoff of VisiCalc. This was okay with the lawyers, I guess, because Brinklin and Frankston never patented VisiCalc’s look and feel (http://www.bricklin.com/patenting.htm). Multiplan differed only a little from VisiCalc, but most of the changes were improvements. One difference was the way the cells were named. Multiplan referred to cells by row and column number, as in R1C1 instead of A1. Not exactly a huge change, but a step in a good direction. Naming columns using letters was not a great idea. I’m sure it seemed okay when VisiCalc was introduced. Back then it probably seemed unlikely that anyone would make spreadsheets with more than a handful of columns. Real paper ledgers had only few columns. But if you for some reason did try to make a lot of columns, you’d better be ready to remember them in base-26 notation. Let’s see... my spreadsheet has 250 columns. Quickly, what will be the name of the last one? You might think that everyone would be happy to have columns with proper base-10 number, as in Multiplan. If you thought that, you would be wrong. Users of electronic spreadsheets were somehow by this time completely sold on the letter-number cell naming convention of VisiCalc, and they hated this about Multiplan. Multiplan did not sell well, even on the IBM-PC, where Microsoft had control of the operating system. Another change was the way formulas were entered. Instead of beginning with an @, Multiplan formulas started with the equals sign (=). This seems to me to be an improvement, but what do I know? VisiCalc and Multiplan were both beaten on the IBM-PC with another blatant ripoff of VisiCalc, Lotus 1-2-3 (released in 1983). The Lotus spreadsheet was different from Multiplan in that it ripped off VisiCalc’s spreadsheet functions with more fidelity, making no improvements whatsoever. However, it did add a charting program, that could create a chart (such as it was, being drawn on the limited IBM-PC display), and (crudely) recognized another kind of data organization, the data base. Addition of these two new features led to the 1-2-3 name. Ironically, Lotus later sued Borland for imitating the Lotus 1-2-3 user interface in yet another VisiCalc ripoff, Quattro Pro, and lost. Heh. Steve Jobs famously quoted Picasso saying that “great artists steal”. There were a lot of great artists in the computer software business in those days.
Multiplan - and then Excel, on the Macintosh
One of the first third party programs released for the Macintosh was Microsoft Multiplan. It was announced at the time of the Macintosh announcement in January 1984. Microsoft still describes Multiplan as the first commercial GUI spreadsheet, and as far as I can tell, this is true. It was a regular spreadsheet in a Macintosh window, but you could use the mouse to select cells, and to do things like saving and reading in files (which used keyboard commands in MSDOS). Multiplan could not make charts, like Lotus, but Microsoft released a graph-drawing program, called Microsoft Chart, at about the same time as Multiplan. Data could be moved between the Multiplan and Chart programs using the clipboard or scrapbook. Chart drew great graphs, and Microsoft did pretty well with Multiplan and Chart, but the Macintosh failed to capture the business market, which was still under the spell of IBM. The Macintosh did well in the science and education worlds, but those guys didn’t use spreadsheets very much, and needed more sophisticated graph-drawing than was offered by Chart. Still, Microsoft did not give up on beating Lotus 1-2-3, and they exploited the absence of that product on the Macintosh. 
In September 1985 they released a new spreadsheet for the Macintosh, named Excel. It looked almost exactly like Multiplan, but used VisiCalc’s letter-number cell naming scheme. Early versions gave users the option of using the R1C1 cell numbering system. It included some Lotus 1-2-3 compatibility features, and included the Chart package, making Microsoft Chart unnecessary. Charts were drawn in a separate window, not integrated into the worksheet the way they are now. Excel was released for the primitive early versions of Microsoft Windows when that became possible in 1987. Making a compound document within Excel, the way it is done now, was not possible through the 1980’s and early 1990’s. This was offered in version 3 (1991). At that point Excel worksheets became live compound documents, putting spreadsheet data and graphs together, in the same worksheet.

Trapeze
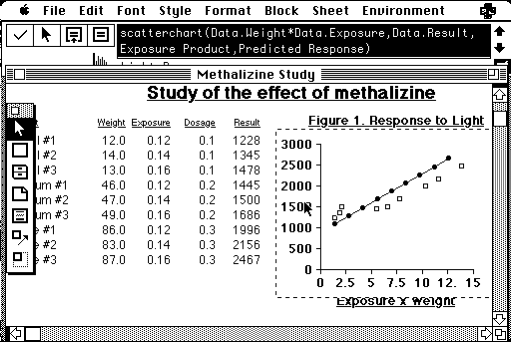
Although Excel users would have to wait till the 1990‘s to have a spreadsheet of the kind we use now, Macintosh users could buy a truly modern spreadsheet starting in January, 1987. It integrated live graph-drawing directly into the worksheet, had advanced (for the time) support for data bases, could apply different text styles to different parts of the document, and its worksheet could display any kind of graphic that could be pasted in from the clipboard. It was called Trapeze, and was written by Andrew Wulf, Bob Murphy and Ken Clark. There are very cool back-to-back demonstrations of Excel and Trapeze in an episode from the Computer Chronicles, from May, 1987. It’s fun even now to watch Andrew Wulf, of Data Taylor (who made Trapeze) totally pwn Microsoft’s Mike Slade, and the Microsoft product, Excel.
Think Different
Trapeze deviated substantially from the VisiCalc model. The worksheet did not have pre-existing columns and rows. It was blank. Maybe that means that Trapeze wasn’t a spreadsheet, because a spreadsheet was defined by the big worksheet full of identical cells. The Trapeze worksheet didn’t have that, but rather a canvas on which you could place one or more variable-sized blocks of spreadsheet cells. You had to drag out a place on the screen to place an array of cells, and you could have a lot of different arrays of cells on the same sheet. Even more radically, there was more than one kind of block of cells possible. To determine which kind of block you made, you had to select a tool from a tool menu, which could be torn off to make a floating tool palette. The kinds of blocks were: number blocks, database blocks, word blocks, text edit blocks, chart blocks and picture blocks, and graphics blocks. The number blocks were similar to an array of cells in VisiCalc, except that they could only hold value entries. If you made a Trapeze worksheet out of a set of blocks, you would be doing things pretty much like the way people use spreadsheets these days. Most spreadsheets that I see use an ad hoc method for making more than one block of data on the worksheet. They use some cells for one block, and some other cells for another, with a bunch of empty cells in between. You can make the cell boundaries disappear in the areas that you aren’t using. But really, there is only one data block, and it fills the entire worksheet. You have to remember that your primary data block is A1-N85, and that your summary data are in P1-P20. In Trapeze, the worksheet could have several truly different blocks, each containing different kinds of data, and addressed by name. Each block had a unique name. Each number block had its own set of cells starting at the upper left hand cell in the block. And here’s the best part. The cells in a number block were named in the tried and true way used by programmers to refer to a 2-dimensional array. The cell in the third row, second column of block myBlock was referred to as myBlock[3,2]. Formulas were applied to blocks of data, not to cells. If you want a row that contains the averages of all the columns in myBlock, you create a new block (of any size) and give it the formula Avg(myBlock,#Col). The block will be resized to a single row with as many columns as myBlock, and the cells filled with the average. No need to fill-propagate the formula. Blocks can be moved around at will, and decorated with block and cell boundary lines. Or not. Without the lines, they are just arrays of numbers on the page.
Databases:
Drawing graphs was the 2 in Lotus 1-2-3. Three stood for databases. They didn’t mean relational database, in the sense of Oracle or mySQL. Database, as they used it at that time, meant little more than that a block of cells in which the cells in each column were of the same data type, and that you could do column-wise arithmetic. If you often find yourself in Excel entering a formula in the top row of a column that depends on a value on another column in that same row, and then filling down to propagate the formula throughout the column, you are trying to make your spreadsheet act like a database. If cell B1 has a number in it, then all cells in column B have numbers, and it makes sense for all cells in column C to be the result of come numeric operation performed on column B (e.g. column B divided by 100). OverVUE, by ProVUE Software was a popular database for the Macintosh in its early days. OverVUE evolved into Panorama, which is still one of the best databases on the Macintosh (or Windows) today. In OverVUE, your screen showed you something that looked a lot like a spreadsheet, except that the all operations on the data were done on a column not a cell. You could make a new column, fill it using a formula in terms of the other columns, sort the database by the value in some column, select or unselect rows or sort rows based on the value in some column, etc. Rows are called records, and the columns within a record are called fields. Data types (like values or labels) are associated with columns.

OverVUE, running in System 1, ca 1984
In the early versions of spreadsheets like Excel, you could declare a block of cells to be a database. Once you did that, the cells’ interpretation changed and a number of new actions were available. The titles of the columns started to mean something. The position of a cell started to seem like it meant something. You could sort or extract records based on the value of some column, addressed by its title. The spreadsheet block looked like the others, and still had addresses like C23, but you didn’t use those addresses any more. Instead you would address the fields within each record in the data base using their names, written at the top of the columns. A special dialog box was used for all of these operations. You didn’t interact with the worksheet directly any more. The dialog box allowed you to create new records, fill out its fields, delete records, etc. But really it was an illusion. This was really just a set of macros that controlled that piece of the spreadsheet using its regular Letter-Number addresses. These functions mostly disappeared from Excel with the development of Microsoft’s full on database program, Access. Some of them continue to exist in the pivot table function. But all that happened in the 1990s.
In Trapeze ca. 1987, you could create a named block that would be a database. The columns in the database block became named entities automatically, and went the default names field1, field 2, etc, which you could change directly. Cells in a database block had to be referred to by blockname, field name, and row number, as in myDBBlock.aField[4]. Formulas in database blocks operated on an entire column in the database. Imagine I had a database named scores, consisting of columns called rawScore, totalPossible, and percentScore. I could calculate the entire column named percentScore, by giving it the formula scores.rawScore/scores.totalPossible*100. No need to fill down, because the formula is evaluated by columns. If I needed to get the percentScore of the 4th record, I would do it a scores.percentScore[4].
The Trapeze notation used to address cells in number blocks, and records, fields and scores in database blocks, was much more symmetric and organized than that used by VisiCalc and its imitators. It was the notation that has been developed over decades of experiences with computer programming languages to refer to variables, 1 and 2-dimensional arrays, and arrays of data structures. Of course, the cost was that you had to learn two different sets of rules for the two different kinds of data blocks. And that wasn’t all. There were actually 7 different kinds of blocks, number, database, chart, picture, graphics, word, and text edit.

Chart, Picture and Graphics Blocks, Word Blocks and Text Edit Blocks
Charts were put on the sheet exactly like number blocks or database blocks. You had to select the correct tool from the Tool Menu, and use it to drag out a place on the worksheet for the chart. Then you type the formula for the kind of graph you want, referring to the database block and columns to be graphed by name. There were a lot of really great charts, including some that you don’t often see in charting programs, like contour charts for 2 dimensional data sets. A full set of editing commands on existing charts allowed a full set of chart customizations. Changes in the database were updated in the chart immediately. Moving a graph, or any other block, was done using a block moving tool, found in the Tool Menu. Likewise there was a resizing tool that could resize any block. If it was a chart block, it would resize the graph. The Tool Menu could be torn off to become a floating palette. Tear off menus were an exciting new thing in 1987, whose popularity driven in part by their innovative use in Bill Atkinson’s Hypercard.
Picture blocks could contain any picture that could be encoded as a PICT file or pasted using the clipboard. In 1987 that meant any picture that you would use on your Macintosh. PIcture blocks couldn’t be edited or used in any calculation, but they could be resized. Pictures were mainly just for decorations.
Graphics blocks contained imagery created in Trapeze rather than pasted in from the outside. These allowed creating of lines, arrows, and simple shapes like rectangles.
Word blocks were like number blocks except that they contained text instead of numbers. Text could be styled using all of the Macintosh text styles and typefaces. Text Edit blocks were blocks that could contained a single text edit field that contained word-wrapped styled editable text. This allowed the attachment of paragraphs of text in a box, anywhere on the sheet. This is another capability that appeared in Excel in version 3, in 1991.
Everything Old is New Again - Apple Numbers
In 2007, as a part of iWork ’08, Apple released its first Macintosh spreadsheet since AppleWorks. Apple Numbers is a simple spreadsheet that allows creating of named data blocks, in a way similar to Trapeze. You can have as many little data blocks as you need, and there’s a great list of data blocks (called Tables) available along the left margin of the window. It draws beautiful graphs, and is a big improvement on the user interface for spreadsheets. Despite the similarity, Numbers is not Trapeze. Twenty-four years later, the new spreadsheet from Apple is decades behind Trapeze. It’s data blocks use the ancient VisiCalc numbering system (although relative to a named block using a double-colon, as in aBlock::A5. Like modern versions of Exel, it tries to get around the worst aspects of this by allowing the user to enter a column name in the top row of the block, and row names in the first column, so you can refer to the column by that name instead of its letter-number name. You can’t do arithmetic on blocks. In Trapeze, I could create a block and assign it to be the matrix product of two other blocks. 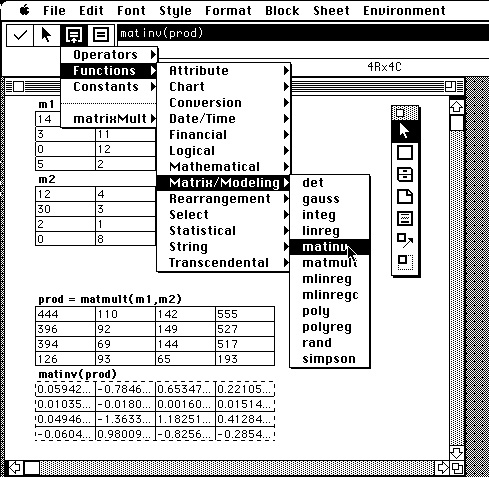
Trapeze would size the new block to the right dimensions, and populate the cells with the right values to be the matrix product. I wouldn’t give the equation to a cell, but to the block. I know, there is a way to do that in Excel. Over time, Excel has developed a bunch of Trapeze-like features that rely on declaring a block of cells to be something other than just a block of cells (like array, in this case). In fact, I think that Excel has by now accumulated a series of things like that that enable it to do everything you could do in Trapeze. This is a good trend, but of course done over decades and at the cost of destroying the purity of the original VisiCalc idea, or any unified design that Excel ever might have had. The method used to define each of the new special kinds of blocks always seems post hoc, different for each one, and hard to remember. Excel is not the kind of program that you can learn without reading a manual. Of course it is like that, because each new feature was a bag hung onto the initial design of Excel years after its original design was complete. In Trapeze, these features were the design. Numbers, which sticks more closely to the simplicity of the old spreadsheet vision, has few of Excel’s more advance features, to say nothing of those from Trapeze. For example, there is nothing I can find that corresponds to column-wise calculations in database blocks in Trapeze. You need to calculate the correct value for one cell in a column, and then fill down. Don’t get me wrong, I use Numbers when I want a spreadsheet (which is seldom). It looks great. But Numbers is not something like Trapeze. It isn’t even a smarter version of Excel. It a prettier, easier, and dumbed-down version of Excel. Maybe, the plan is to add more and more sophisticated capabilities to Numbers, so that eventually it will gain the capabilities of today’s Excel (or those of Trapeze in 1987), and surpass it in ease of use and elegance of design. I hope so. But if they haven’t figured out how they are going to do it already, it’s going to end up being as much a post hoc patchwork as Excel.
There has never been a replacement for Trapeze. Like a lot of other great software, it never made the transition to System 7. When that happened, I quit using spreadsheets, and started using Mathematica for the things that Trapeze used to do.
-- BG (basalgangster@macGUI.com)
Saturday, March 26, 2011